
Determining the discount rate for a project is a complex matter that may fundamentally change the viability of the investment in the project. To solve the problem, two factors were determined. One is the sensitivity tests of the venture in several possible scenarios and the other is the way market investors perceive the risk of the venture.
The relationship between internal risk and investor risk market data depends on how investors perceive risk and translate it into the level of venture risk in the eyes of investors and the venture’s cost of capital. There are several options for risk-averse, average risk-prone, and risk-loving types of investors. Therefore, there is a match between the normal distribution of a particular market and its characteristics, and the desire of investors to operate in that market according to the levels of risk that they anticipate concerning a given market.
In calculating the sensitivity of the project (in the following example), only 2 variables were taken. One is the price and the other is the quantity. There are other variables such as cost per unit, but since cost per unit is a function of the product price, when the cost price increases, the product price also increases (or the risk level increases in the case where the price does not increase), to maintain the gross profit rate and thus compensate for an increased risk as an outcome of the decrease in gross profit.
Also, there are other scenarios in which fixed expenses are a function of the quantity sold since it can be assumed that when more are sold, or when operational efficiency decreases due to increasing the total number of transactions, fixed expenses increase.
In the example presented in this article, the number of scenarios is relatively low. In practice, it is possible to determine a greater number of scenarios, thus reaching a level of detail that considers a higher number of scenarios.
single scenario formula
Sensitivity tests examine different situations of the enterprise’s operating profit according to the following formula:
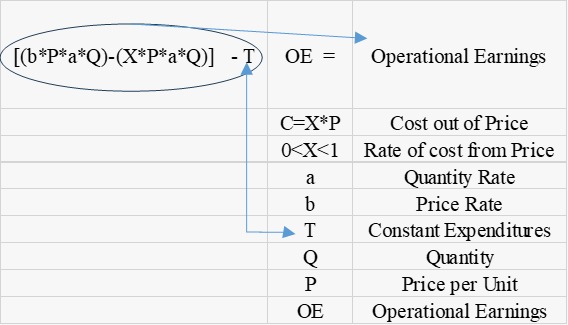
This formula addresses every possible scenario. As we increase the number of scenarios, the cumulative probability increases and the second derivative of the function will determine the nature of the normal distribution (low, medium and high risks).
The following example depicts the computing of sensitivity tests in different scenarios
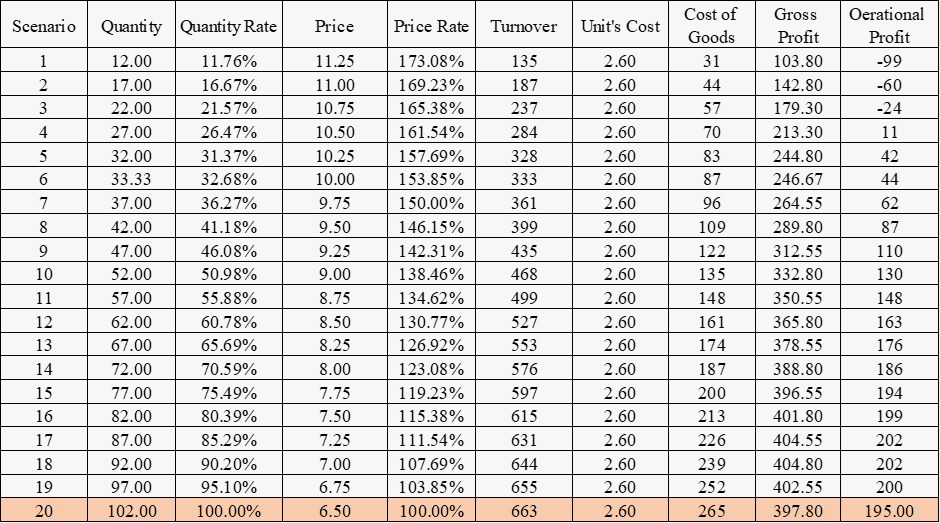
In the given example, several cross options of price and quantity were taken which describe a possible sensitivity of the project for one year. The logic is that if the price is high (up to 100%) a maximum quantity will be sold, while when it is at a relatively low price, we will receive a proportion of the quantity according to the table.
The break-even point in the case of the example is obtained at a sales quantity of 24.88 and a given price of 10.75. Or a given quantity of 22 and a variable price of 11.82. The table describes 100% of the possible scenarios concerning dependent variables such as price and quantity.
normal probability
The determination of normal probability for the various scenarios indicated in the example is determined according to the risk levels of the market investors as follows (the second derivative of the risk function between scenarios will determine the investors’ perception of risk):
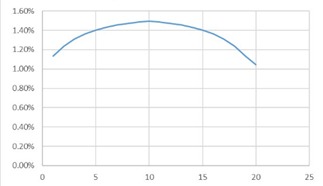
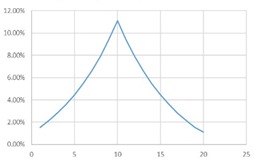
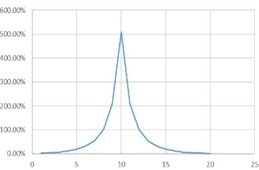
The flatter the curve, the lower the level of the investor’s perceptive risk. In a steep distribution with most options moving around the median, market deployment is low and market investors will be risk averse. A normal distribution that is chosen depends on the risk of the venture measured according to the cross-sensitivity of the variables and is adjusted to the investors’ perception of the risk level of the market. The equilibrium point of the discount rate is at the intersection between the internal risk and the investors’ risk rate.
Calculation of internal risk interest
The risk interest rate is determined according to the probability of any cross-sensitivity for a given option according to the normal distribution of the perception of risk in the eyes of the investors of the industry. The formula by which the interest is calculated is as follows:

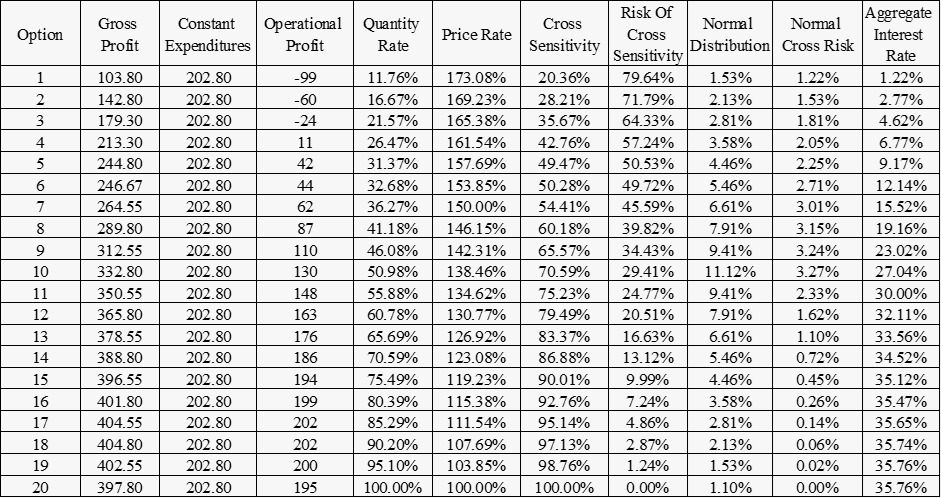
Where A is the option of a quantitative variable array rate relative to the reference point while B is a price variable array rate relative to the reference point, the cross-sensitivity is B*A where Pr is the probability of the possibility happening according to the selected normal distribution (low-risk certainty, average-risk certainty, high-risk certainty). Below are the calculation results of the example in the market of average risk investors:
Analysis of results and conclusions (as an example only)
The risk interest determined is according to the decision of the investors in the project. In our case (as an example only) about 50% of the most common cases were taken according to the distribution of events in the project. The determined interest rate is the consolidation of the events between option 7 and option 13, therefore the risk interest rate of the venture is 17.72% for one year.
In our case, N = 13 and x = 7 and the union of the events determines the interest rate is the aggregate sum of the normal cross risk of scenarios 7 to 13.
If investors in the venture determined that for them the risk ranges from option 4 to option 16, the level of risk in the eyes of the investors would increase and the annual interest rate would reach 26.17%.
To illustrate this model, when dealing with a completely risk-free project, the cross-sensitivity is 100% (since each scenario is the same as the previous one and does not differ from the basic premise of the project), the internal risk level of the project according to the formula is 0%.
As another example, assuming that the cross-sensitivity is higher in each scenario or that the only variable is the quantity and not the price (constant), the internal risk level of the enterprise is lower with the investors’ perception of the risk level.
Note: This model computes the investor’s risk perception of the scenarios. In real life, the minimum risk level of investors, may add to the result a risk-free interest rate, so the final formula will be: risk-free interest rat+Rn
