
Background
Israel had experienced short terms of real estate price fluctuations but long terms of rising. We can imagine why: When the state of Israel with a few hundred’s of thousands of Jews in its dawn and a very shaky odds for surviving, is now one of the powerful nations in the Middle East with one of the strongest economies and armies that can secure it from its zealot enemies.
It is reasonable to contemplate that prices rise will proceed. The question is why do we experience short terms of fluctuations. The answer is also simple. In an attempt to decrease prices of real estate and to let our youngsters buy their first apartment in their homeland, the Israeli government increases taxes and levies in order to decrease demand from investors and to draw a line of cheaper prices to Jewish citizens who live here or wish to immigrate from other states.
Trends and cause
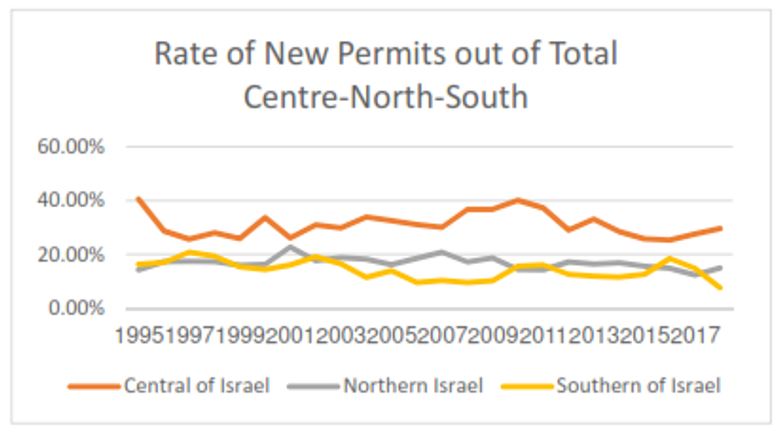
One basic question relates to the human mind in order to understand trends logic. First, people would like to feel “safe” and “safe” is to expect what happens next. If prices are up, everybody thinks that there is a demand and vice-versa. We can see that constructors and entrepreneurs think that the center of Israel is better to build on, than in the north or south. We can see the below charts and get the idea. If we do think that this what happens, we will continue to develop the center of Israel at the expense of the North and the South. This thinking fuels the next periods and trends can be more of the same. After we get used to it, this is our reality.
| New permits of Dwelling Units | |||||||
| Period | Centre | North | South | Tel Aviv | Haifa | Jerusalem | Total |
| 1995 | 26,453 | 9,312 | 10,663 | 5,267 | 7,370 | 4,055 | 65,234 |
| 1996 | 16,694 | 10,066 | 9,867 | 4,851 | 8,702 | 6,035 | 58,217 |
| 1997 | 14,722 | 9,997 | 11,967 | 4,302 | 5,876 | 4,290 | 57,442 |
| 1998 | 11,886 | 7,309 | 8,183 | 4,549 | 4,141 | 2,960 | 42,370 |
| 1999 | 10,361 | 6,402 | 6,144 | 4,392 | 4,442 | 2,178 | 39,999 |
| 2000 | 14,513 | 7,031 | 6,203 | 4,152 | 3,759 | 3,861 | 43,137 |
| 2001 | 8,652 | 7,545 | 5,339 | 3,518 | 3,859 | 2,252 | 33,188 |
| 2002 | 10,671 | 6,092 | 6,577 | 4,021 | 3,141 | 2,530 | 34,487 |
| 2003 | 9,004 | 5,689 | 5,007 | 3,264 | 3,296 | 2,020 | 30,248 |
| 2004 | 9,600 | 5,144 | 3,247 | 4,292 | 2,258 | 1,993 | 28,331 |
| 2005 | 10,547 | 5,250 | 4,506 | 4,856 | 2,673 | 2,808 | 32,478 |
| 2006 | 9,464 | 5,654 | 2,902 | 4,888 | 2,165 | 3,858 | 30,468 |
| 2007 | 9,361 | 6,471 | 3,216 | 4,906 | 2,002 | 3,027 | 31,160 |
| 2008 | 12,164 | 5,715 | 3,170 | 4,293 | 2,142 | 2,898 | 33,171 |
| 2009 | 12,289 | 6,231 | 3,415 | 4,612 | 2,669 | 1,757 | 33,477 |
| 2010 | 17,352 | 6,225 | 6,778 | 5,326 | 3,489 | 3,152 | 43,353 |
| 2011 | 18,739 | 7,165 | 8,111 | 6,334 | 4,602 | 4,276 | 50,339 |
| 2012 | 13,215 | 7,837 | 5,746 | 7,894 | 4,933 | 4,520 | 45,515 |
| 2013 | 16,600 | 8,202 | 5,957 | 6,895 | 5,740 | 4,172 | 50,153 |
| 2014 | 13,634 | 8,079 | 5,544 | 7,063 | 7,646 | 4,081 | 47,967 |
| 2015 | 14,377 | 8,678 | 6,980 | 8,679 | 10,577 | 4,070 | 55,715 |
| 2016 | 13,680 | 7,993 | 9,970 | 7,690 | 7,947 | 4,287 | 54,055 |
| 2017 | 14,962 | 6,675 | 8,030 | 7,874 | 10,896 | 3,877 | 54,271 |
| 2018 | 16,047 | 8,123 | 4,142 | 14,831 | 6,191 | 5,216 | 54,271 |
| Total | 324,987 | 172,885 | 151,664 | 138,749 | 120,516 | 84,173 | 1,049,046 |
| New permits of Dwelling Units | |||
| Period | Central Israel | Northern Israel | Southern Israel |
| 1995 | 40.55% | 14.27% | 16.35% |
| 1996 | 28.68% | 17.29% | 16.95% |
| 1997 | 25.63% | 17.40% | 20.83% |
| 1998 | 28.05% | 17.25% | 19.31% |
| 1999 | 25.90% | 16.01% | 15.36% |
| 2000 | 33.64% | 16.30% | 14.38% |
| 2001 | 26.07% | 22.73% | 16.09% |
| 2002 | 30.94% | 17.66% | 19.07% |
| 2003 | 29.77% | 18.81% | 16.55% |
| 2004 | 33.89% | 18.16% | 11.46% |
| 2005 | 32.47% | 16.16% | 13.87% |
| 2006 | 31.06% | 18.56% | 9.52% |
| 2007 | 30.04% | 20.77% | 10.32% |
| 2008 | 36.67% | 17.23% | 9.56% |
| 2009 | 36.71% | 18.61% | 10.20% |
| 2010 | 40.02% | 14.36% | 15.63% |
| 2011 | 37.23% | 14.23% | 16.11% |
| 2012 | 29.03% | 17.22% | 12.62% |
| 2013 | 33.10% | 16.35% | 11.88% |
| 2014 | 28.42% | 16.84% | 11.56% |
| 2015 | 25.80% | 15.58% | 12.53% |
| 2016 | 25.31% | 14.79% | 18.44% |
| 2017 | 27.57% | 12.30% | 14.80% |
| 2018 | 29.57% | 14.97% | 7.63% |
So, now we are almost sure that the majority of investors, constructors and entrepreneurs do believe that the center of Israel is a better place for them, for all kinds of reasons: Standard of living, development, high demand and big profits.
The government as a factor
Even the government can’t solve these trends and increase of prices. Why? Governments work according to obsolete policies. They can ask for more taxes regarding highly demand areas, investors etc. This can’t work for long, because nobody can ask for more taxes whereas people can’t earn and people can earn more in the center, better than in other places. We can’t provide incentives to build the North or South because budgets are limited and fiscal policies derive only from public beliefs that generate more income. Giving these presumptions, governments can’t go against public trends and/or beliefs. If it tries to, it will probably send our economy into a recession.
What can we expect for?
Providing these abovementioned ideas, we can make other parts of Israel to thrive the same as in the center, by persuading the public to believe that their standard of living will not be affected. Governments work slow, bound to laws and can’t really be effective in persuading people.
In democracies, the public decides what will happen. The way is to make the public believe can be generated both by entrepreneurs and investors.
Instead, our government restrict profits from entrepreneurs and doesn’t develop other places in the same way as it does across the center because it can’t really lead. Market forces are much stronger. Municipalities contribute to it as well and consume whatever they can to enhance their wealth.
Conclusion: More of the same, unless we divert our trends by beliefs and facts on the ground.
Numbers and Calculations
The annual average number of immigrants in the last 4 years is around 25,000 (which requires around 7,000 new dwelling units). The fertility rate is approximately 2% of the total population, so the top expected demand for new dwellings are around 185,000 per annum. Part of the population is married (30%) minus the divorce rate (27%). The death rate in Israel is approximately 0.3% of the total population (27,000) and therefore we can figure out the number of net new required dwellings.
The population in Israel is around 8.9 Million. As mentioned above the top number of new required dwelling facilities is 185,000 per annum. If we take it and subtract the married couples, mortality rate and add divorcees we get the following result:
185,000-mortality-married couples + divorcees= 117,785*
*(you can turn to the publisher for the exact computation)
This means that each year we get a shortage of approximately 65,000 dwellings units. If we believe that a large part of the population wishes to leave in the center, we can assess a shortage of hundreds of thousands of dwellings units in the next few years.
What our options are?
First, I offer people who have money to buy apartments in areas of high demand. I believe that prices will continue to rise. Secondly, it is important to see whether the government and/or municipalities have extraordinary plans for certain areas even though these areas, for now, do not have high demand. This may be attractive because of environmental, cultural facilities and infrastructure developing.
We believe that there is no escape but to realize that Israel is and will face housing crises because of bad governmental performance and market forces. Younger generations will have to look for other places than Israel, to live in. Anyhow, an increase in differentiation and alienation between socio-economic classes and groups will grow and many young and educated people will have to emigrate, unless we find stable solutions.
