
An example was prepared for a company that had been surveyed for about 12 years. The company’s characteristics show that the sales cycles, which are indexed to inflation, indicate instability in terms of profit and current costs, impacting the company’s EBIDATA. The question here is how to estimate the risk interest rate and capitalization factor to get a relatively accurate estimate of the company’s value from an investor’s point of view. The review was conducted without tax calculations.
1. The test method
The internal risk rate of the enterprise is tested by standard deviations, where there are two options. One is to examine the standard deviation of the EBIDATA (gross profit minus operating expenses without depreciation, tax and financing), and the second option is to examine the standard deviation of the sales cycles and add the risk of variables that make up the EBIDATA throughout the sample period using the Cowley model. We chose the second option and included components of the EBIDATA and additional components related to the company’s CAPEX and OPEX.
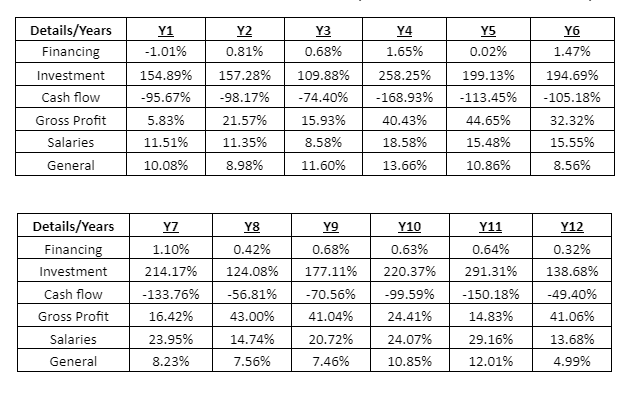
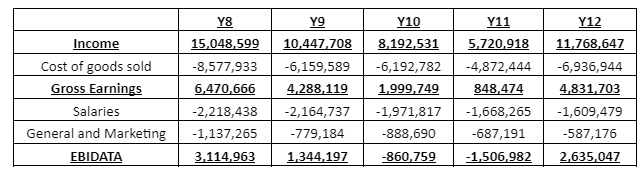
2. Nominal Annual P&L of the company
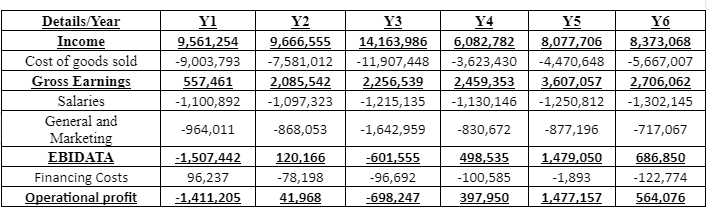
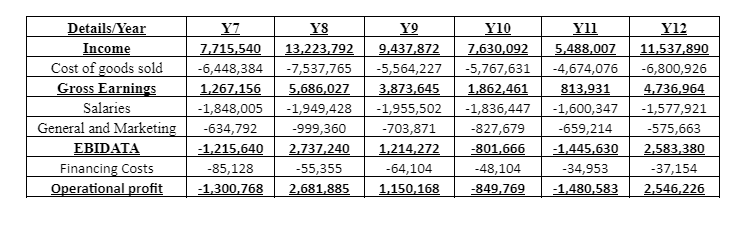
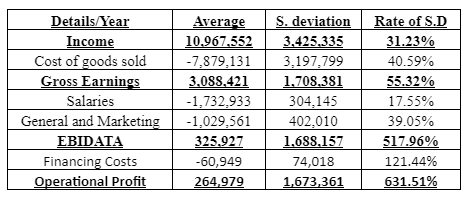
The indexation, average values, and standard deviation of the abovementioned reports are as follows:
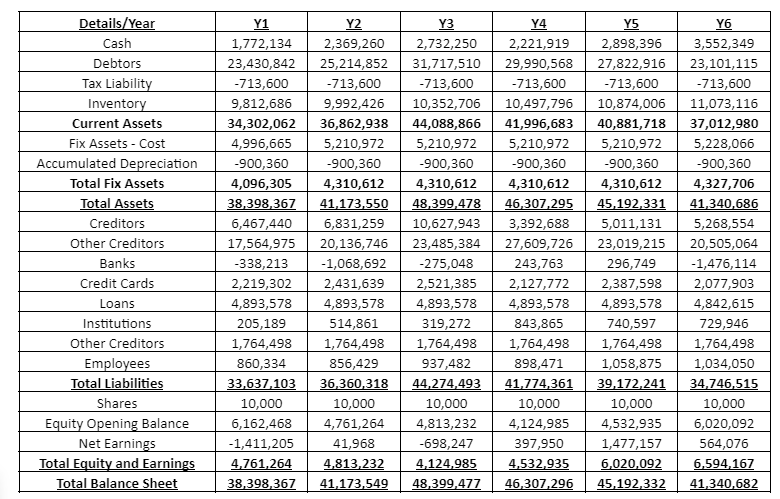
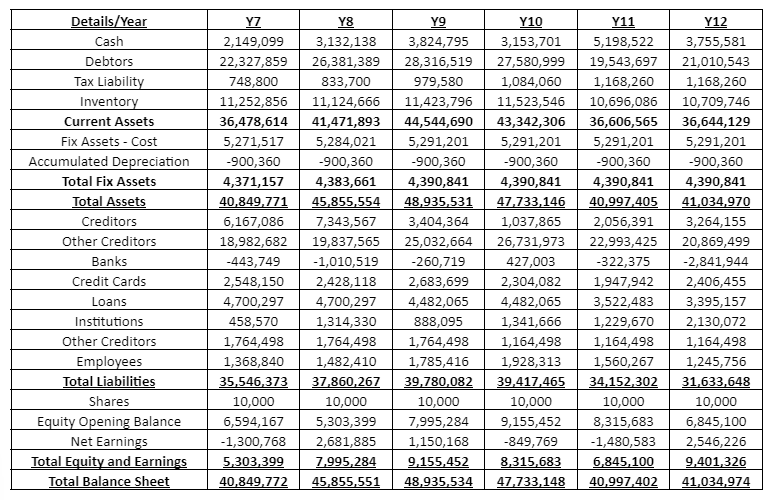
3. Nominal Annual Balance Sheets of the company
4. Calculation of risk rate for the company
The internal interest rate is calculated according to the standard deviation of the sales and according to a normal distribution, assuming that the other variables are constant. A normal distribution indicates how investors view various events and the associated risk’s perception. The type of normal distribution (high, average, and low risk) allows different levels of risk to be obtained for events that, from the investor’s point of view, are significant to the valuation. In the example before us, 100% of the cases of average normal distribution were taken.
The calculation table is based on a standard deviation rate of 31.23% from the sales amount of 10,967,552 down to 8,357,406.
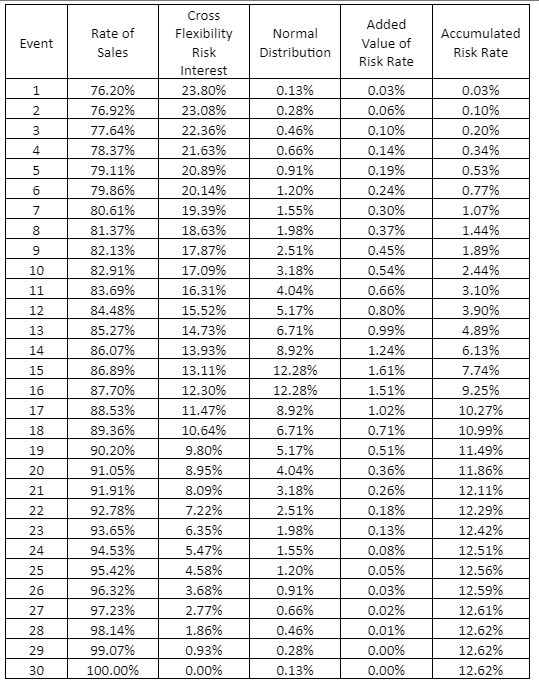
According to the table above, the basic interest rate that reflects the internal risk of the sales cycle is 12.62%. In this example, we assessed the Cowley model with additional relevant variables to check the company’s final risk rate.
5. Calculation of additional risk according to the Cowley model
The risk’s assessment regarding additional variables is carried out according to functions empirically adapted to investors’ perceptions of risk. In this framework, functions that negatively affect the risk and those used positively on it were diagnosed empirically. For example, the higher the cost of selling, the higher the level of risk, and in the same way, the higher the salary and general costs are, the higher the level of risk. The values that make up the functions to obtain the chance and/or risk values are divided by the company’s annual turnover. Below are the calculation results:
The gross profit and the cash flow decrease the risk and increase the chance as their value increases. Therefore, these functions are dubbed “increasing”. On the other hand, financing, investments, salaries, and general expenses are variables that increase the risk and decrease the chance. Therefore, these functions are dubbed “decreasing”.
Below are the results of the Cowley model in calculating the St of the sample (the St formula can be seen in the previous articles):

6. Placing the data in the Cowley model
The formula for the chances of success is as follows:
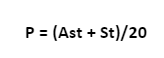
When Ast in this example is set at a value of 5, which means that from the point of view of the market (variables that contribute to the company’s success within the industry in which it operates), the market’s contribution is 50%. The company’s internal contribution (through the St) and its characteristics have a maximum weight of 50%. The A value itself in the selected case is at a rate of 25% (A = Ast / 20)
Note: In the case of a complete positive contribution of the internal variables to the company’s success and close to 100% support from the market, we will receive success rates close to 100%. Also, the internal weight array of the model variables must be coordinated with the number of variables to obtain an optimal St value that does not fall below the maximum score (in the case of the model not exceeding 10 or 1000%) before weighting in the number of periods.
Determination of Ast and A
The market index can be measured as a function of the β of the market with mandatory changes. The capital market index β is an index calculated as the joint variance of the company interest rate and the market interest rate divided by the variance of the market as follows:
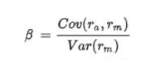
The β values reflect the company’s share price propensity with the entire market. For example, if the market rises by 10% and the company’s stock by 5%, then the β is 0.5. Usually, this index ranges from minus 0.5 to +5, so it should be translated into a value that fits the Cowley Model. This index reflects the effect of market fluctuations or the industry’s expectations, as it may be, on the company’s stock prices in the same way that A is used in the Cowley model.
That is, checking the impact of the market on the company’s success rate. For clarification, the following table indicates the risk levels according to the values that Ast and A receive:
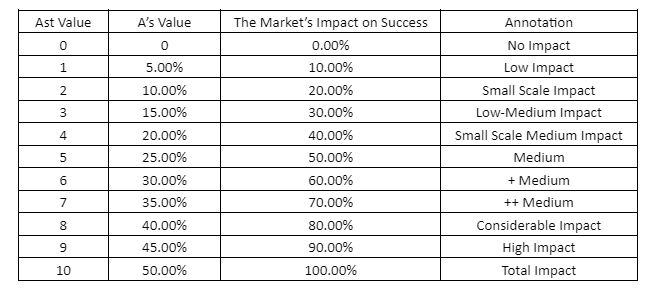
Note: Different β values can be normalized depending on the assessment of the level of market influence on the risk or in terms of the company’s results. In this example, it was decided that the market impact on the company’s success rates would be taken as 50% with a value of A at a rate of 25% (according to its weight in the model). In a separate article, we will construct the set of values of A that fit various β values of the industry.
The results of the calculation of the chances of success and risk are as follows:

The risk formula of the Cowley Added Risk Rate is as follows:

The aggregate risk increment of the model as calculated is 115.2% and the final interest rate is according to the following formula:
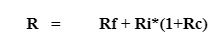
Rf is the risk-free interest rate, and Ri is the internal risk rate calculated for the company plus the risk rate according to the Cowley model (Rc).
The total discount rate based on the total model is 32.17%, assuming a risk-free interest rate of about 5%. The adjusted multiplier is 3.11.
7. Conclusions
Despite the company’s relatively stable turnover, it fails to produce a stable EBIDATA, and the risk regarding management costs, gross profit, and cash flow does not guarantee stability. On the other hand, the company’s financing expenses are relatively low, meaning that it operates with leverage based on interest-free debt.
Assessing inventory and gross profit records is not an easy task. Accrual gross profit is reasonable, but periodically, according to the financial statements, there is a lot of volatility. The management of the personnel (salaries) of the company in general seems reasonable, with a standard deviation of about 17%. Before selling, there is a need to take care of volatility and reach relatively stable EBIDATA levels. In any case, if we take the most probable EBIDATA, assuming that there is a possibility of repairing the flaws, the valuation may reach higher values, according to the indexed EBIDATA of the last five years.
Below are the indexed company’s profit and loss results for the last 5 years:
The below table represents a few options under different values of Ast and A:

When the market supports and influences the company positively, the values of A get higher. As we mentioned, it is also possible to adjust the β values of the capital market and quantify the analyst reports regarding the state of the industry and the entire market. Anyhow, investors are required to examine their risk assessment regarding the market and thus determine the value of A from their point of view.
From here, we may get the value of the company under the following ranges:

