We conducted an example for a company reviewed over approximately 12 years. The company's characteristics are such that inflation-adjusted sales turnover indicates instability in terms of profit, operating costs and sales, while the company's EBITDA is highly volatile. The question here is how to estimate the risk and discount rate in order to obtain a relatively accurate valuation of the company from an investor's point of view. The review was conducted without tax calculations.
1. Method of Analysis
The internal risk rate of the venture is examined via standard deviation, where there are two options. The first is to examine the standard deviation of the EBITDA (gross profit less operating expenses, excluding depreciation and financing), and the second is to examine the sales turnover and then weight the risk of the variables comprising the EBITDA over the sample period using the Cowley model. We chose the second option, and included in the ongoing analysis components of the EBITDA as well as additional components related to the company's Capex and Opex.
2. Profit & Loss Statement and Balance Sheets
Annual nominal profit and loss statements
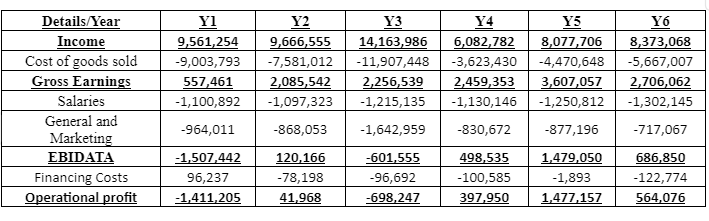
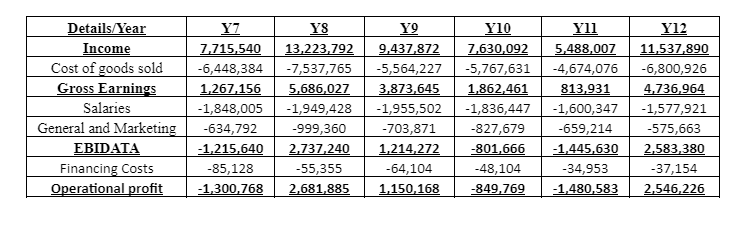
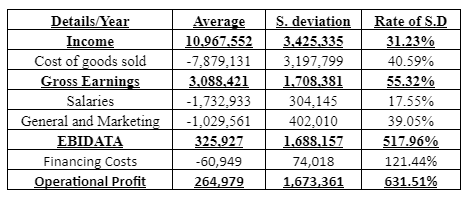
After adjusting the statements to the index at the end of 2023, the index-linked standard deviations and averages are as follows:
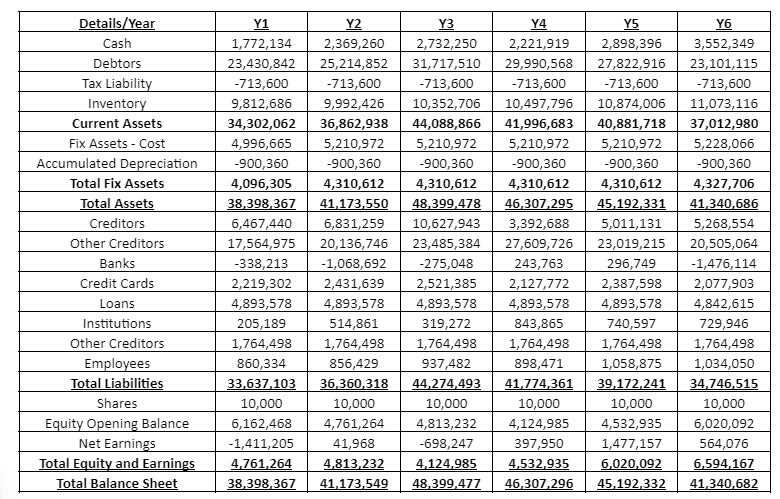
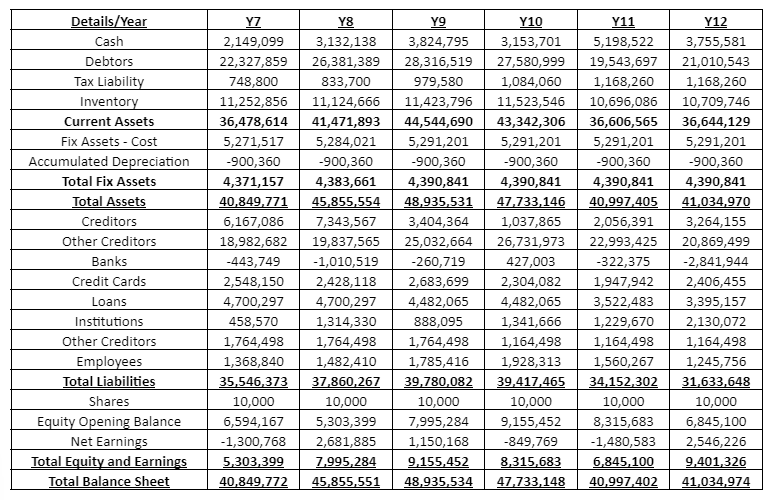
3. Annual Nominal Balance Sheets of the Company
4. Calculating the Company's Risk Rate
The rate is calculated according to the standard deviation of sales and a normal distribution, assuming all other variables are constant. A normal distribution reflects the way investors view the various events and their perception of the associated risk. The type of normal distribution (high, average and low risk) enables obtaining different risk levels for events that are significant to the company from the investor's perspective. In the example before us, 100% of the cases of an average normal distribution were taken according to the standard deviation of sales.
The calculation table is based on a standard-deviation rate of 31.23% of the sales sum of 10,967,552, down to a sales sum at standard deviation of 8,357,406.
The calculation results are as follows:
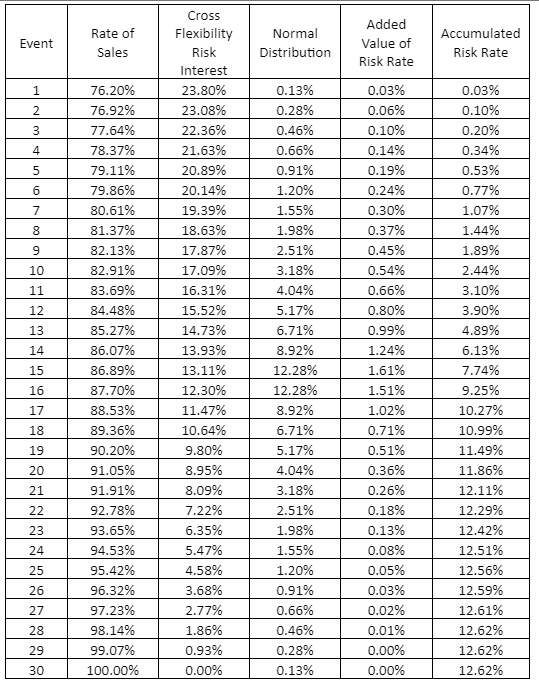
According to the example above, the base rate reflecting the internal risk of the sales turnover is 12.62%. To this base figure we perform a follow-up calculation according to the Cowley model, which includes additional relevant variables required to examine the company's final risk rate.
5. Calculating the Additional Risk According to the Cowley Model
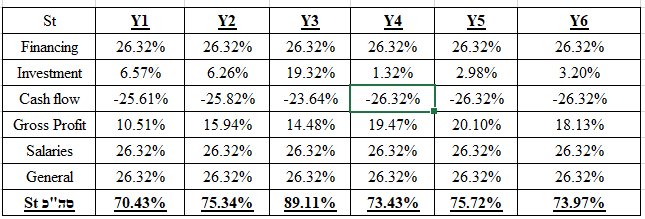
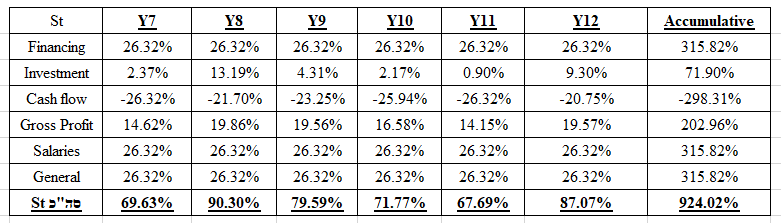
The tests for determining the risk of additional variables are performed using functions empirically adapted to investors' risk perception. In the empirical testing, functions that negatively affect risk and those that positively affect it were identified. For example: the higher the cost of goods sold, the higher the risk level; and in the same way, the higher the salary and general expenses, the higher the risk level. The values comprising the functions for obtaining the chance or risk value are divided by the company's annual turnover. The calculation results are as follows:
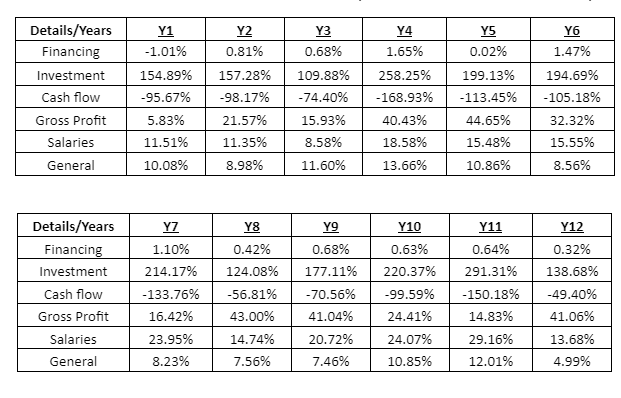
Gross profit and cash flow reduce the risk and increase the chance as their value rises, and therefore these functions are called “rising”. On the other hand, financing, investments, salary and general expenses are variables that increase the risk and reduce the chance, and therefore they are called “falling”.
Below are the results of the Cowley model in calculating the St of the sample (the St formula can be seen in the previous articles):
6. Placing the Data into the Cowley Model
The success-chance formula is as follows:
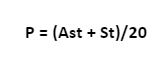
When Ast is set at a value of 5, it means that from the market's point of view (variables contributing to the company's success within the sector in which it operates), the market's contribution is 50%. The company's internal contribution (via the St) and its characteristics carries a weight of up to 50%. The value A itself, in the chosen case, is at a rate of 25% (A = Ast / 20).
Note: In the case of a full positive contribution of the internal variables to the company's success, together with support of close to 100% by the market, we obtain success rates that are also close to 100%. Likewise, the internal weight array of the model's variables must be coordinated with the number of variables to obtain an optimal St value that does not fall below the maximum score (in this model, it does not exceed 10, or 1000%) before weighting for the number of review periods.
Determining Ast and A
A market index according to the capital market can be measured as a function of the market's β (beta), with the required adjustments. The capital-market index β is calculated as the covariance of the company's rate and the market rate, divided by the variance of the market, as follows:
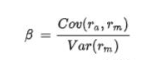
The β values reflect the way the company's share prices change relative to the change in the market shares as a whole. For example: if the market rises by 10% and the company's share by 5%, then β is 0.5. This index usually ranges between −0.5 and 5, and therefore it must be translated into a value that expresses the market's effect on the company's share. This index reflects the way market fluctuations, or the expectations from the sector where relevant, affect the company's share — similarly to the purpose of index A in the Cowley model.
That is, it examines the degree of the market's effect on the company's success rate. When referring to Ast and A, for clarification, a table is attached indicating the risk levels according to the values that Ast and A receive, as follows:
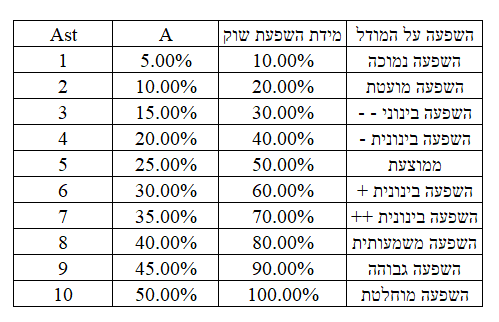
Note: Different β values can be normalized according to the assessment of the market's effect on risk, or in terms of the company's results. In this example, it was decided that the market's effect on the company's success would be taken as 50%, with a value of A at a rate of 25% (according to its weight in the model). In a separate article, we will present the formula required for the array of A values as a function of the β values, in order to adapt the A and St values to the capital markets.
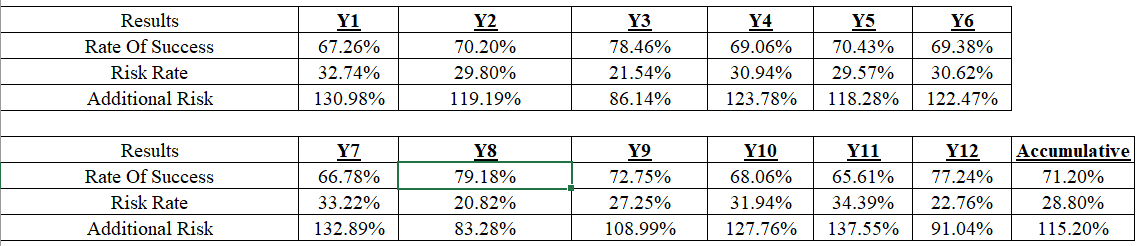
The calculation results of the success chances and the risk are as follows:
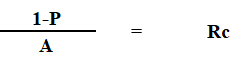
The risk formula of the Cowley index is as follows:
The aggregate additional risk of the model, as calculated, is 115.2%, and the final rate is according to the following formula:
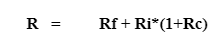
Where Rf is the risk-free rate, and Ri is the internal risk rate calculated for the company, plus the risk rate according to the Cowley model (Rc).
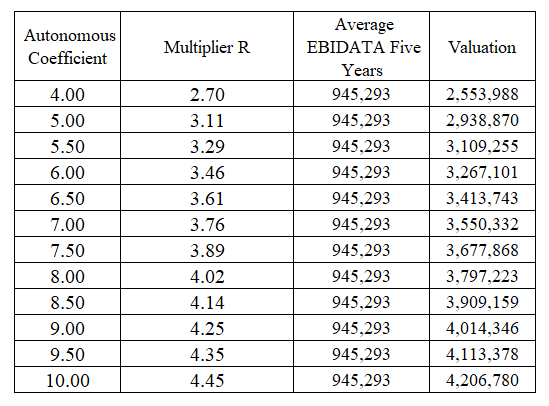
The total discount rate based on the comprehensive model is 32.17%, assuming a risk-free rate of approximately 5%. The adjusted multiplier is 3.11.
7. Conclusions
Despite the company's relatively stable turnover, it fails to generate a stable EBITDA, and its ongoing operations — including cash flow — are at a relatively high risk level. On the other hand, the company's financing expenses are relatively low, meaning it operates with leverage based on interest-free debt.
In our assessment, there is a problem with inventory-record management and gross profit. The total gross profit is stable, but at the annual level, according to the records, it is highly volatile. Manpower management, or the company's management capability in general, appears reasonable, with a standard deviation of about 17%. Before a sale, the gaps must be corrected and relatively stable EBITDA levels must be reached.
Below is a table of the model's results according to different values of A and the additional risk added to the final discount rate:
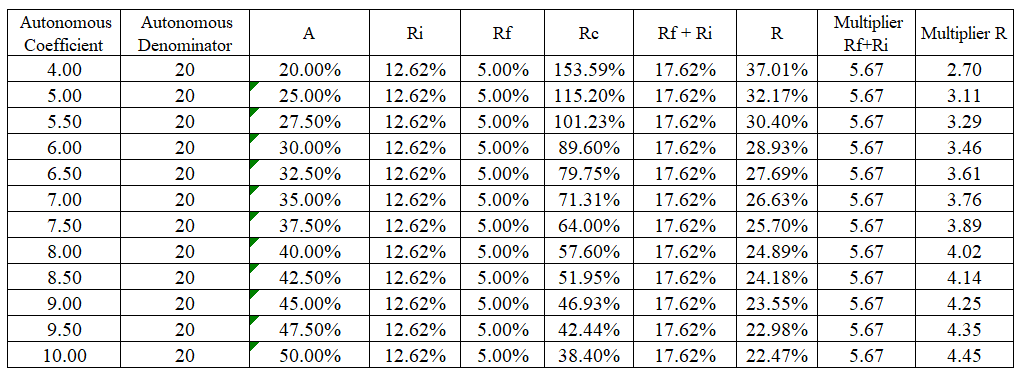
When the market affects the company in a way that raises the success rate (a small negative effect, or relatively high A values), this means reducing the discount rate and raising the value. As noted, the β values of the capital market can be normalized, and analysts' reports regarding the sector and market as a whole can even be quantified. An investor is required to examine their own risk assessment regarding the market, thereby determining the value of A from their point of view. In the following table, a company value is obtained across selected ranges: